Short answer
Redrock is a 35-minute research case inside McKinsey Solve. Prep guides describe a study in three phases (investigation, where you save data to a research journal, then analysis and a report) followed by six standalone mini-cases on the same clock. Collect only what the objective needs, and protect about 10 minutes for the cases.
Key takeaways
- One 35-minute clock covers the study and the six mini-cases. Every published split protects 10 to 12 minutes for the cases, because candidates most often run out of time there.
- The research journal is the whole game. Save only what the objective asks for, label each card with unit, period and place, and the analysis and report go quickly.
- The math is simple but full of traps: percent versus percentage points, simple versus weighted averages and mixed units. Write the formula before you touch the calculator.
In this article
- What is the McKinsey Redrock Study?
- How does the research journal work?
- What math does the Redrock analysis ask for?
- How does the Redrock report work?
- How do the six Redrock mini-cases work?
- How should you split Redrock's 35 minutes?
- Can you go back to an earlier Redrock phase?
- Can you solve this Redrock-style study?
- Step 1: what goes in the journal?
- Step 2: analysis
- Step 3: the report
- Step 4: a mini-case
- Where can you practice Redrock?
- What should you check in each Redrock phase?
Part ofWhat Is McKinsey Solve? A Guide to Redrock, Sea Wolf and SFL
If your Solve invitation says 65 or 85 minutes, candidates report that 35 of them belong to the Redrock Study. Redrock is where most people lose time, not because the math is hard but because they save too much data, re-read the same chart three times and reach the mini-cases with four minutes left. Below: how each phase works, what the journal should look like, the three math traps that cost the most points, a 35-minute plan, and a full Redrock-style example you can work through now.
What is the McKinsey Redrock Study?
Redrock is one of the games in McKinsey Solve, the online assessment McKinsey sends to many applicants before the first interview. You play a researcher answering a question about a fictional natural system: animal populations, plant growth or a resource across regions. The data comes as text, tables and charts, and you work through it in a fixed order.
Prep guides that rebuild the game describe two parts on one clock:
| Part | Phase | What you do | What it feeds |
|---|---|---|---|
| 1. Study | Investigation | Read the research article and exhibits; drag the data points you need into the research journal | Everything after it |
| 1. Study | Analysis | Answer calculation questions using the saved data and an on-screen calculator | The report |
| 1. Study | Report | Fill in a partly written report: numbers, "higher" or "lower", and the chart that best shows a finding | Your study score |
| 2. Cases | Six mini-cases | Answer standalone questions, each with its own small exhibit | Your case score |
McKinsey says no business knowledge is needed and that each game opens with a tutorial. That is true. The case for practice is time: every minute you spend learning where the journal is or how the report screen works comes out of the 35.
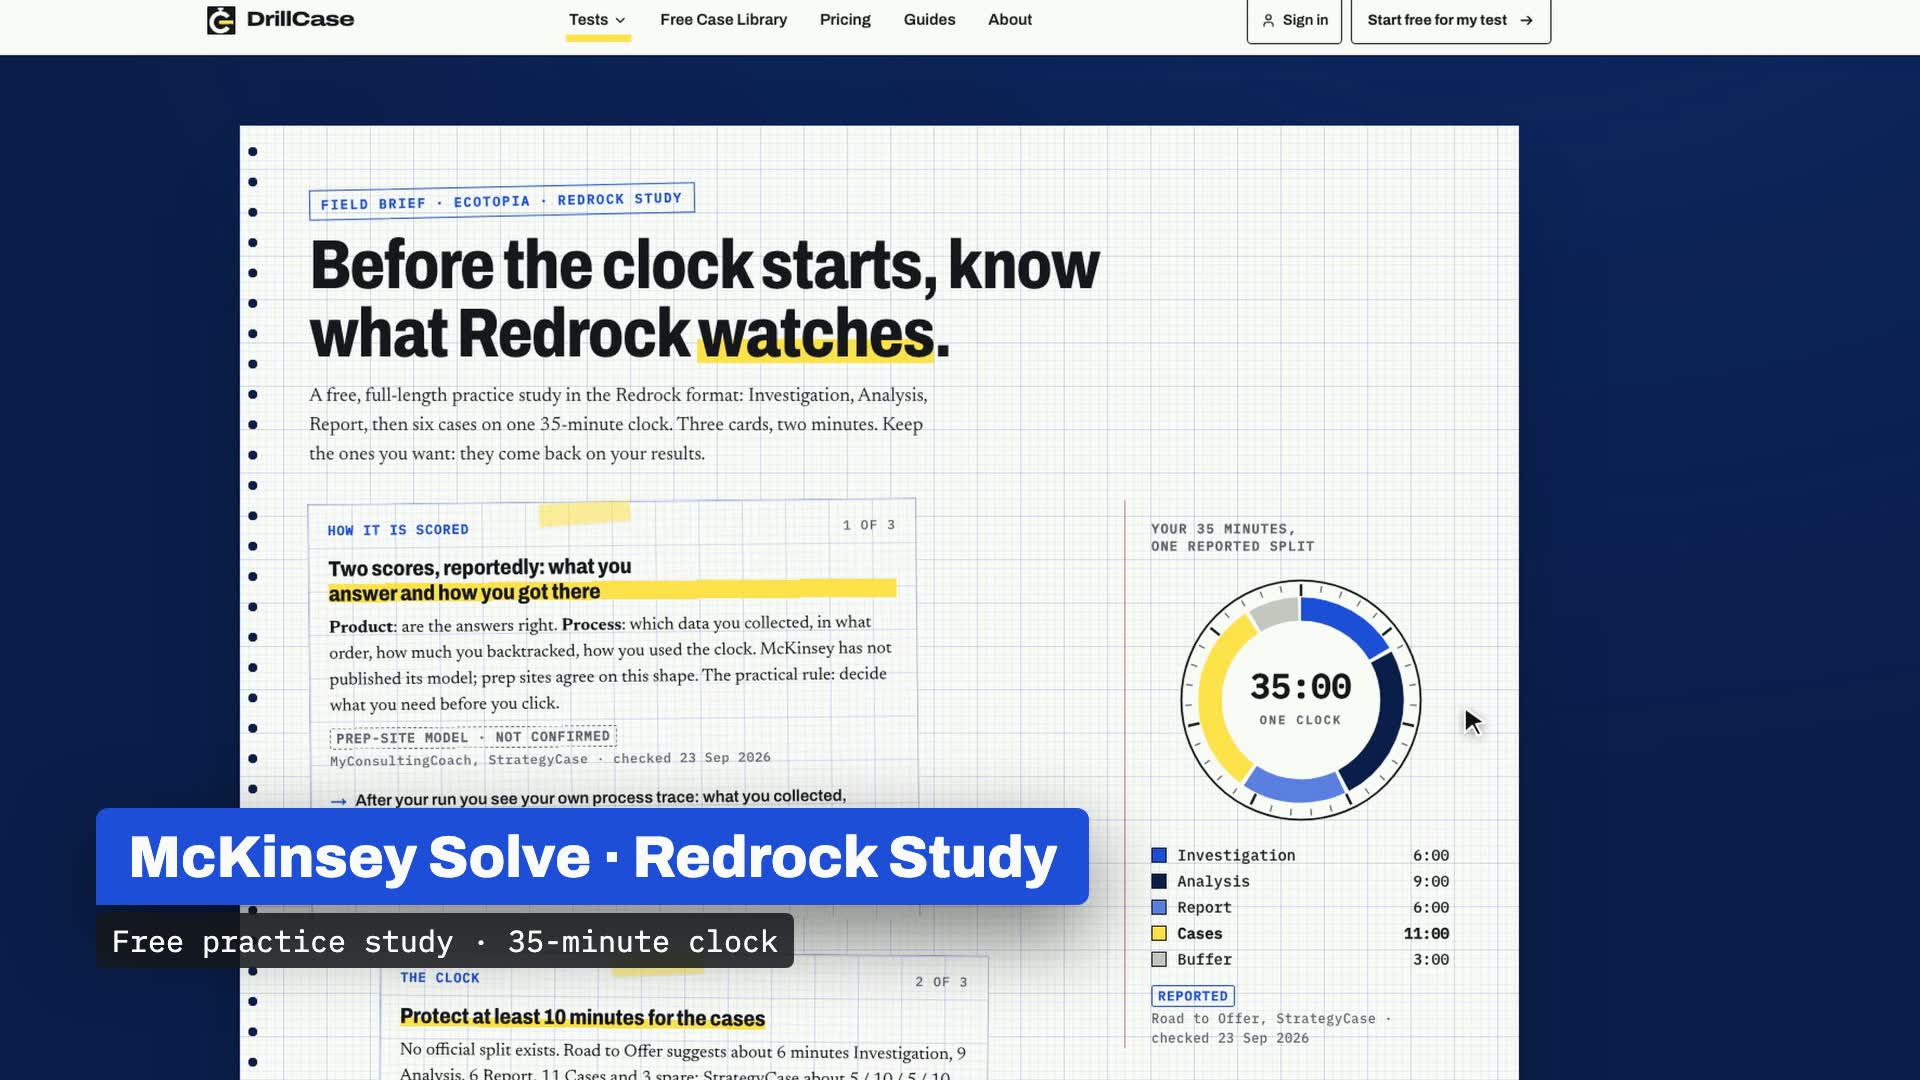
This walkthrough of our Redrock-style practice shows the journal, the analysis questions and the report on screen.
How does the research journal work?
In the investigation phase you read a short research article with exhibits. Anything that might matter, you drag into the research journal, a panel on the right of the screen. Each saved item becomes a card that you can label, and the cards travel with you into the analysis and the report. psgsecrets and StrategyCase both report that the calculator connects to the journal, so you can drag a saved value straight into a calculation.
That makes the journal the single biggest lever in Redrock. A tidy journal turns analysis questions into lookups. A messy one turns them into a second investigation.
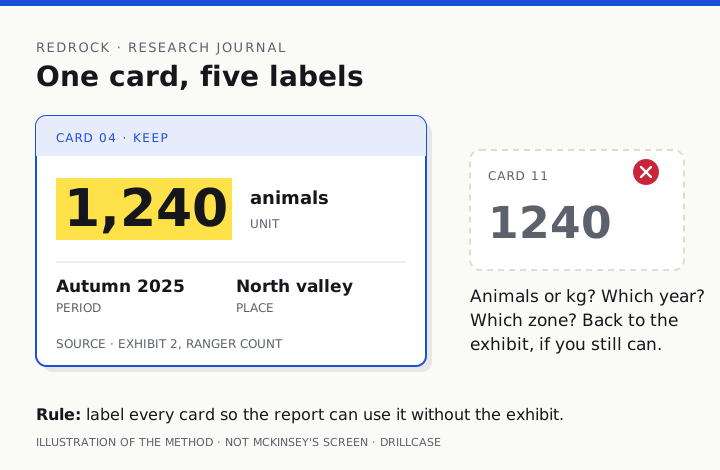
Four rules make a journal that works:
- Read the objective twice before you save anything. StrategyCase advises spending about a minute on it. The objective tells you which variable is the answer and which are inputs.
- Treat every data point as a yes or no. Does the objective need it, or does a later question obviously need it? Yes: save it. No: move on. Seawolf Prep's guide suggests "around 8–12 well-labelled cards for a typical scenario", not 30.
- Label with unit, period and place. "1,240" is useless in the report. "1,240 animals, North valley, 2025" is not.
- Save totals and the parts you will compare. If the article gives a total and three regional figures, you usually need the total and the region the question is about, not every region.
The cost of over-collecting is not only time in the investigation. Every extra card is one more thing to scan when an analysis question asks for a specific value, and StrategyCase lists over-collection first among common Redrock mistakes.
What math does the Redrock analysis ask for?
The analysis phase asks a handful of calculation questions (StrategyCase reports three to five) using the data you saved. The operations are basic: percentages, percentage points, growth rates, ratios and averages. The difficulty is that each question is built to punish one specific slip.
| Trap | What the question asks | Wrong answer it invites | How to avoid it |
|---|---|---|---|
| Percent vs percentage points | "By how much did the share change?" | 30% when the answer is 6 percentage points | Read whether the unit is % or pp before you calculate |
| Simple vs weighted average | "What is the average across regions?" | The plain average of three rates | Weight by the size of each group whenever group sizes differ |
| Growth base | "By what percentage did it grow?" | Change divided by the new value | Divide by the starting value |
| Mixed units | "What is the total?" | Adding thousands to units, or months to years | Convert everything to one unit on the card before you add |
Road to Offer notes that some versions keep a calculator log of unrounded results. If yours does, chain from the log instead of retyping rounded numbers, because rounding early can push a later answer outside the accepted range.
For the full set of calculation habits, including when the calculator is slower than mental math, see our guide to McKinsey Solve calculator rules.
How does the Redrock report work?
The report is a partly written research summary. Prep guides describe three kinds of blank: a number you calculated, a direction ("higher" or "lower", "increased" or "decreased"), and a chart that shows a finding, where you choose the chart type and fill in its values.
The numbers and directions are quick if your journal is clean. The chart choice is where people hesitate. A default that matches what the guides recommend:
| The finding is about | Choose | Not |
|---|---|---|
| Comparing categories at one point in time | Bar chart | Pie chart |
| A trend over time | Line chart | Bar chart with many periods |
| Parts of one whole at one time | Pie chart | Line chart |
| Composition changing over time | Stacked bar | Several pie charts |
| Whether two variables move together | Scatter plot | Line chart |
Before you submit, run three checks: units match the sentence, the direction word agrees with your number, and the chart answers the sentence above it. Road to Offer's checklist is close to this.
How do the six Redrock mini-cases work?
After the report, the study closes and the cases begin. Each mini-case is self-contained: a short prompt, a small table or chart, and one question. Road to Offer lists the kinds it sees: choosing which evidence answers a question, a percentage share, ranking by a rate, mean versus median, a simple probability and a ratio after a change.
Because each case is independent, they reward a steady pace more than deep thought. Road to Offer suggests under 2 minutes per case, which means about 12 minutes for all six. The most common failure the guides describe is not a wrong answer on a hard case, it is reaching case one with five minutes on the clock.
How should you split Redrock's 35 minutes?
McKinsey publishes no split. Three prep providers publish suggested ones, and they agree on the main point: keep 10 to 12 minutes for the cases.
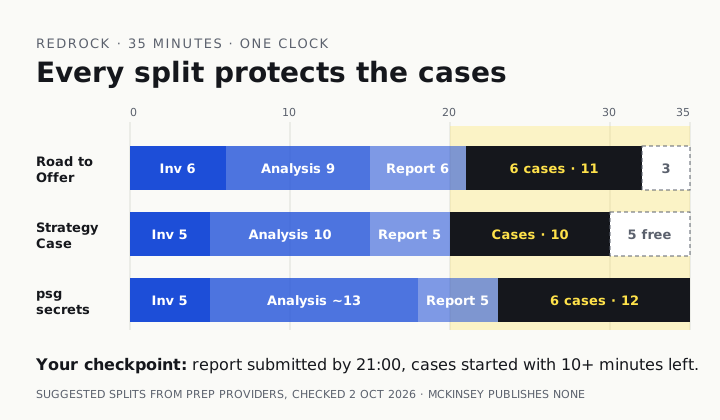
| Checkpoint (clock elapsed) | Where you should be |
|---|---|
| 1:00 | Objective read twice; you know which variable is the answer |
| 6:00 | Investigation done; journal holds roughly 8 to 12 labelled cards |
| 15:00 | Analysis submitted |
| 21:00 | Report submitted |
| 33:00 | Six cases answered |
| 35:00 | Buffer used only for a final check |
If you are behind at 15:00, shorten the report, not the cases: fill every blank with your best answer and move on.
Can you go back to an earlier Redrock phase?
The guides do not agree, which is a reason to prepare for the strict version:
| Source | What it reports |
|---|---|
| Road to Offer | Phases run one way: "once you advance you cannot return" in versions that work that way |
| psgsecrets | You can go back to the investigation from the analysis, but not from the cases to the study |
| StrategyCase | A side panel allows movement between stages, but switching screens repeatedly "reads as indecision" |
All three point to the same habit: finish each phase before you leave it. If going back exists in your version, use it for one missing value, not as a second investigation.
Can you solve this Redrock-style study?
The scenario below is invented for practice. It is shorter than the real study but uses the same steps. Try each question before reading the answer.
Objective. A conservation team asks: did the share of juvenile deer in the valley's herd rise between 2024 and 2025, and which zone drove the change?
Article excerpt. The valley is split into three zones. Rangers counted the herd each autumn. In 2024 the herd was 2,000 deer, of which 400 were juveniles. In 2025 the herd was 2,500, with 650 juveniles. Average adult weight was 92 kg in 2024 and 95 kg in 2025. A dry summer in 2025 reduced grass cover in the East zone by about a fifth. A new road was proposed through the West zone.
| Zone | Deer 2025 | Juveniles 2025 | Grass cover change |
|---|---|---|---|
| North | 1,000 | 300 | +5% |
| East | 600 | 90 | −20% |
| West | 900 | 260 | 0% |
Step 1: what goes in the journal?
Save: herd 2024 (2,000), juveniles 2024 (400), herd 2025 (2,500), juveniles 2025 (650), and the three zone rows for 2025. Skip: adult weight, the road proposal and grass cover, unless a question asks. They describe the valley, not the objective. That is seven cards, each labelled with year and zone.
Step 2: analysis
Q1. By how many percentage points did the juvenile share change? 2024: 400 ÷ 2,000 = 20%. 2025: 650 ÷ 2,500 = 26%. Change: +6 percentage points. The trap answer is 30%, which is the relative change (6 ÷ 20).
Q2. Which zone has the highest juvenile share in 2025? North 300 ÷ 1,000 = 30%. East 90 ÷ 600 = 15%. West 260 ÷ 900 = 28.9%. North. The trap is West, which has the second-most juveniles but a larger herd than you might assume.
Q3. Check: does the zone data match the herd total? 1,000 + 600 + 900 = 2,500, and 300 + 90 + 260 = 650. Yes. A five-second check like this catches a mislabelled card before it costs you the report.
Step 3: the report
"The juvenile share of the herd increased from 20% to 26%, a rise of 6 percentage points. The North zone had the highest juvenile share in 2025."
Chart: to show the juvenile share by zone in 2025, pick a bar chart (categories at one point in time) with the values 30, 15 and 28.9.
Step 4: a mini-case
A second survey found 12 sick deer in a sample of 300. If the same rate holds across the 2,500-deer herd, how many deer are sick? 12 ÷ 300 = 4%, and 4% of 2,500 = 100. Under a minute is the target.
Where can you practice Redrock?
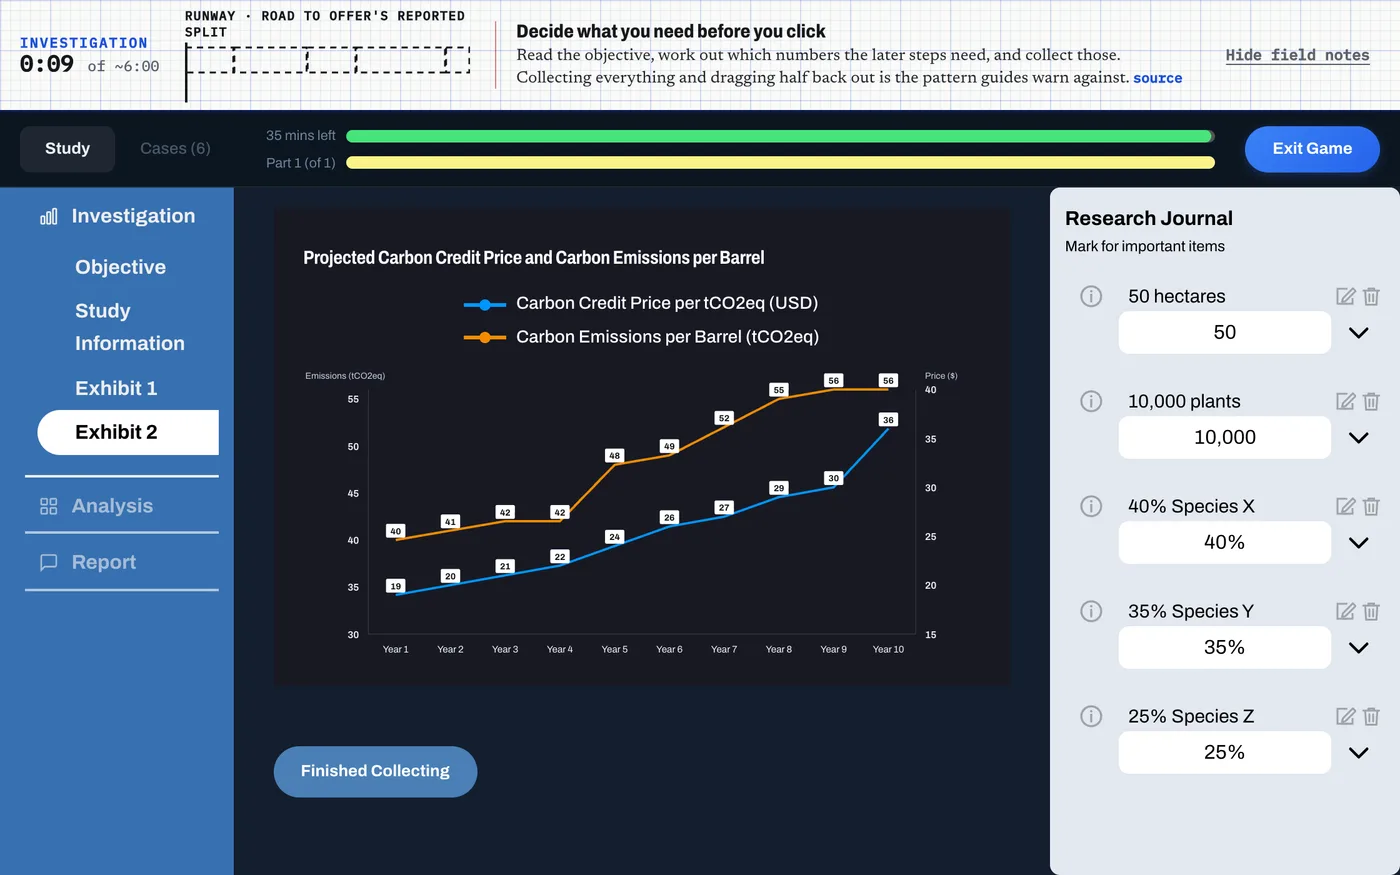
DrillCase's free Ecotopia study is a full Redrock-style study with an investigation menu, a research journal, analysis questions, a report and a 35-minute timer. It opens without sign-in, so you can use it as a baseline run today. The paid McKinsey practice adds more Redrock-style studies, Sustainable Futures Lab sets and unlimited Sea Wolf runs; the McKinsey practice page lists what each plan opens.
DrillCase is independent and is not affiliated with McKinsey. The scenarios are built from what candidates and prep guides report, not from McKinsey material. McKinsey expects Solve to be taken alone and without outside tools beyond what the invitation allows, so practice belongs to the days before the test, never during it.
If your invitation has not arrived yet, or you are not sure which games your length means, the free Invite Decoder shows the games candidates report for each length and sends one task a day to your test date. The McKinsey Solve guide covers the whole assessment, and the Sea Wolf averaging rule covers the other game on every current invitation.
What should you check in each Redrock phase?
| Investigation | Analysis | Report | Cases |
|---|---|---|---|
| Objective read twice | Formula written before calculating | Units match the sentence | Under 2 minutes each |
| 8 to 12 labelled cards | % or percentage points? | Direction word agrees with the number | Best answer, then move on |
| Totals and the compared parts saved | Weighted where groups differ | Chart type fits the finding | Started with 10 or more minutes left |
Frequently asked questions
How long is the Redrock Study?
Candidates and prep guides consistently report 35 minutes for the whole game, covering the study (investigation, analysis, report) and the mini-cases. McKinsey says only that the length of your Solve assessment is in your invitation email, so check yours.
How many mini-cases are in Redrock?
Road to Offer, psgsecrets and StrategyCase all report six standalone mini-cases in the current version. psgsecrets notes earlier versions had more. Each case brings its own small exhibit, so a mistake in one does not carry into the next.
Is there a calculator in Redrock?
Yes. Prep guides report an on-screen calculator, and some versions keep a log of results that you can drag into the journal or the next answer. StrategyCase advises using it for every calculation, since process is reportedly recorded.
Can you go back to an earlier phase in Redrock?
Sources disagree. Road to Offer says that once you advance you cannot return in versions that work that way; psgsecrets says you can go back to the investigation from the analysis but not from the cases to the study. Plan as if every step is final.
How is Redrock scored?
McKinsey does not publish a scoring model or pass mark for Redrock. Prep providers report a product score (your answers) and a process score (how you worked, such as what you saved and how you calculated). Treat both as real and keep a clean, consistent method.
Is there free Redrock practice?
DrillCase's Ecotopia study is a full Redrock-style study with a research journal and a 35-minute timer, free and without sign-in. It is independent practice built from candidate reports, not McKinsey's game.
Practice what you just read
Rehearse Redrock, Sea Wolf and the Lab on a clock
Solve rewards candidates who already know where everything is on the screen. DrillCase's scenarios follow the working layout candidates describe (investigation menu, exhibits, research journal, timer), so on test day your attention goes to the numbers.
- Solve-style scenarios
- 21
- Redrock-style studies
- 10
- free demo scenario
- 1
- 10 Redrock-style studies, 10 Sustainable Futures Lab-style sets, a Sea Wolf-style game with unlimited generated runs, and an archive of 2 Ecosystem games
- Timed sessions with a built-in tutorial on the first screen
- 1 demo scenario is free, so you can check the fit first
Solve VIP ($159) carries a 7-day money-back guarantee, even if used; Basic is final sale. Refund policy. DrillCase is independent practice material and is not affiliated with McKinsey, BCG or Bain.
Sources
- McKinsey & Company, Solve: McKinsey's Assessment Game FAQs (August 2025 PDF)
- Road to Offer, McKinsey Redrock Study guide (updated 22 September 2026)
- StrategyCase, McKinsey Solve Red Rock Study (updated 9 September 2026)
- StrategyCase, McKinsey Solve (updated September 2026)
- psgsecrets, McKinsey Redrock: the complete guide to the game (2026 version)
- MyConsultingCoach, McKinsey Solve Guide (updated June 2026)
- Seawolf Prep, McKinsey Redrock Study: phases, math and strategy (2026)
- CaseBasix, McKinsey Solve full guide (updated August 2026)