Scenario listRedrockSea WolfSFL
McKinsey Solve practice scenarios, by game
21 timed scenarios across today's Solve games, with Sea Wolf as unlimited generated runs. The Ecotopia Redrock study is free to play in full, with no sign-in. Sea Wolf and 3 Redrock studies open with Solve Basic ($99); every scenario opens with Solve VIP ($159). Each is one payment.
Departures
Pick a game. 21 timed scenarios · What each game tests
35:00Game 1 · 10 scenarios
Redrock Study
Data analysis, exhibit interpretation, and written reports under time pressure.
Read first Can you use a calculator on Solve?
- 01
EcotopiaAnalyze environmental and economic data for the Ecotopia region using exhibits, research journal, and built-in calculator. 4 quantitative questions + written report.Clock: 35 minIntermediateAccess: Free · Gate 1
- 02
Costa ThalesInvestigate the Costa Thales dataset — navigate exhibits, save key figures to your research journal, and answer 4 data analysis questions under time pressure.Clock: 35 minIntermediateAccess: Basic or VIP
- 03
 Kokona FalliStudy the Kokona Falli case materials, interpret charts and data tables, then produce a written report with supporting graph selection.Clock: 35 minAdvancedAccess: Basic or VIP
 - 04
Bali VillageAnalyze economic and environmental indicators for the Bali Village region. Drag key data points to your research journal during the study phase.Clock: 35 minBeginnerAccess: Basic or VIP
- 05
Isla AzulWork through the Isla Azul exhibits — charts, data tables, and case information — then answer 4 quantitative questions and select visuals for your report.Clock: 35 minIntermediateAccess: VIP
- 06
Zahari PlainsInvestigate the Zahari Plains dataset using the built-in calculator and multi-exhibit navigation. Complete the analysis and report phases within 35 minutes.Clock: 35 minAdvancedAccess: VIP
- 07
Selva NovaStudy the Selva Nova case — review background information, navigate data exhibits, and synthesize findings into a written report with graph selection.Clock: 35 minIntermediateAccess: VIP
- 08
Cedarburn RidgeAnalyze the Cedarburn Ridge region's data across multiple exhibits. Use the research journal to capture key figures for your quantitative analysis.Clock: 35 minAdvancedAccess: VIP
- 09
Purple LineInvestigate the Purple Line case materials — study phase, 4 analysis questions, and a report phase with written summary and visual report selection.Clock: 35 minBeginnerAccess: VIP
- 10
 NolotilesWork through the Nolotiles scenario — navigate exhibits with drag-to-journal functionality, answer data interpretation questions, and produce a final report.Clock: 35 minIntermediateAccess: VIP
30:00Game 2 · unlimited generated runs
Sea Wolf
Microbe selection: pick microbes whose average characteristics meet each contaminated site's target ranges.
Read first Sea Wolf microbe math: the averaging rule

20:00Game 3 · 10 scenarios
Sustainable Futures Lab
Ranking and prioritization questions as an environmental team project unfolds.
- 01
Urban Air Quality ImprovementSituational judgement, not analysis: 13 team situations from an urban air-quality programme where traffic, industry and construction all read as the culprit and the datasets disagree. Rank four opening moves, then choose your response to twelve situations — no exhibits, no calculations, no right answer. Every choice is scored against five competencies and answered with feedback on the spot. 20 minutes timed.Clock: 20 minIntermediateAccess: VIP
- 02
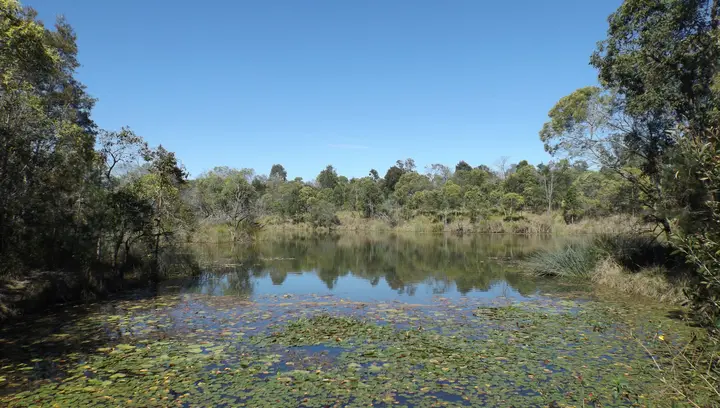 Wetland RestorationSituational judgement, not analysis: 13 team situations from a wetland where water levels, vegetation and returning migratory birds move on different timescales and the link between them is not yet proven. Rank four opening moves, then choose your response to twelve situations — no exhibits, no calculations, no right answer. Every choice is scored against five competencies and answered with feedback on the spot. 20 minutes timed.Clock: 20 minIntermediateAccess: VIP
 - 03
Forest Biodiversity RestorationSituational judgement, not analysis: 13 team situations from a forest recovery programme where regeneration is underway in some zones and stalled in others, and replanting, pollinators and logging pressure all compete for the same effort. Rank four opening moves, then choose your response to twelve situations — no exhibits, no calculations, no right answer. Every choice is scored against five competencies and answered with feedback on the spot. 20 minutes timed.Clock: 20 minIntermediateAccess: VIP
- 04
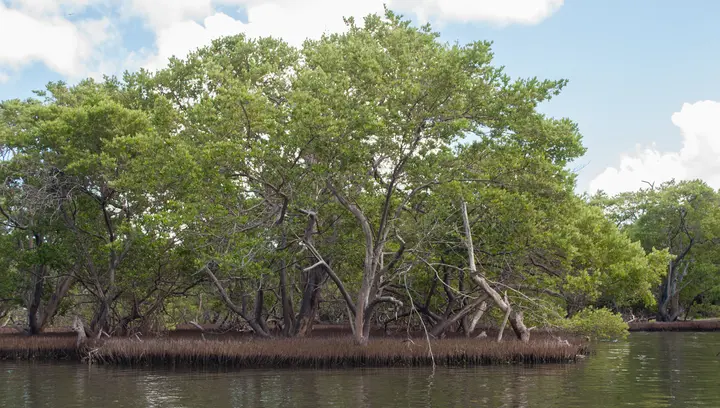 Coastal Mangrove RestorationSituational judgement, not analysis: 13 team situations from a mangrove restoration where salinity, erosion and the fishing communities that depend on the coast pull the plan in different directions. Rank four opening moves, then choose your response to twelve situations — no exhibits, no calculations, no right answer. Every choice is scored against five competencies and answered with feedback on the spot. 20 minutes timed.Clock: 20 minIntermediateAccess: VIP
 - 05
 Urban River RestorationSituational judgement, not analysis: 13 team situations from an urban river whose decline is blamed on industrial discharge in one stretch and on runoff and waste in another. Rank four opening moves, then choose your response to twelve situations — no exhibits, no calculations, no right answer. Every choice is scored against five competencies and answered with feedback on the spot. 20 minutes timed.Clock: 20 minIntermediateAccess: VIP
 - 06
Coastal Habitat RecoverySituational judgement, not analysis: 13 team situations from a coastline whose decline has a different cause in every stretch — water conditions here, human use there — and the readings openly contradict each other. The broadest scenario of the ten: it exercises all seven competencies, including interpreting conflicting information and structuring the problem. Rank four opening moves, then choose your response to twelve situations. 20 minutes timed.Clock: 20 minAdvancedAccess: VIP
- 07
Urban Green Space ExpansionSituational judgement, not analysis: 13 team situations from a green-space expansion where the districts that need it most have the least land and the districts with parks are not using them. Rank four opening moves, then choose your response to twelve situations — no exhibits, no calculations, no right answer. Every choice is scored against five competencies and answered with feedback on the spot. 20 minutes timed.Clock: 20 minIntermediateAccess: VIP
- 08
Alpine Wildlife RecoverySituational judgement, not analysis: 13 team situations from an alpine recovery where vegetation and water access vary sharply across the range and the herbivore decline is already reaching the predators. Rank four opening moves, then choose your response to twelve situations — no exhibits, no calculations, no right answer. Every choice is scored against five competencies and answered with feedback on the spot. 20 minutes timed.Clock: 20 minIntermediateAccess: VIP
- 09
Grassland Regeneration ManagementSituational judgement, not analysis: 13 team situations from a grassland whose fire and grazing cycles have broken down, leaving some zones overgrown and others grazed bare. Rank four opening moves, then choose your response to twelve situations — no exhibits, no calculations, no right answer. Every choice is scored against five competencies and answered with feedback on the spot. 20 minutes timed.Clock: 20 minIntermediateAccess: VIP
- 10
Freshwater Ecosystem BalanceSituational judgement, not analysis: 13 team situations from a lake-and-river system where one species has taken the lion's share of the nutrients and the rest cannot recover. Rank four opening moves, then choose your response to twelve situations — no exhibits, no calculations, no right answer. Every choice is scored against five competencies and answered with feedback on the spot. 20 minutes timed.Clock: 20 minIntermediateAccess: VIP
ArchiveEcosystem Creation archiveReported phased out of most invitations in 2025 · practise it only if yours names it
Most Solve invitations now name Redrock and Sea Wolf; the 85-minute one adds the Sustainable Futures Lab. These two food-web scenarios are kept as an archive, for an invitation that still names Ecosystem Creation.
- Coral Reef · 35 min · VIP only
- Mountain Ridge · 35 min · VIP only
Which plan opens which scenarios
- Ecotopia Redrock study
- Free, no sign-in
- Solve VIP · all 21 scenarios, lifetime access, 7-day money-back
- $159 once
- Solve Basic · 3 Redrock studies + unlimited Sea Wolf runs, for a 65-minute invitation, 1-year access, final sale
- $99 once
Other firms BCG Casey chatbot case practice · Bain online test practice · Free case libraryDrillCase is independent and not affiliated with McKinsey & Company.